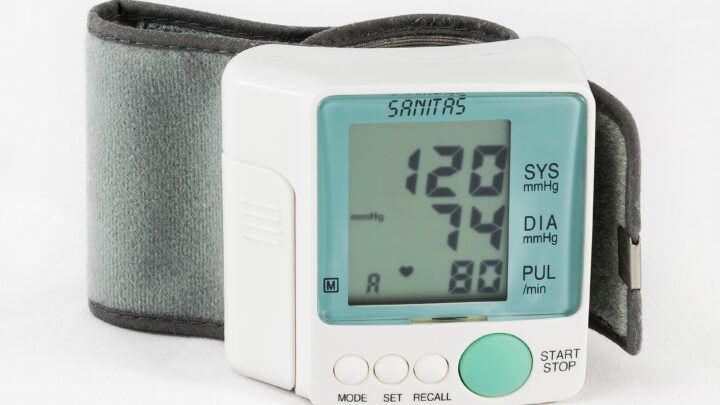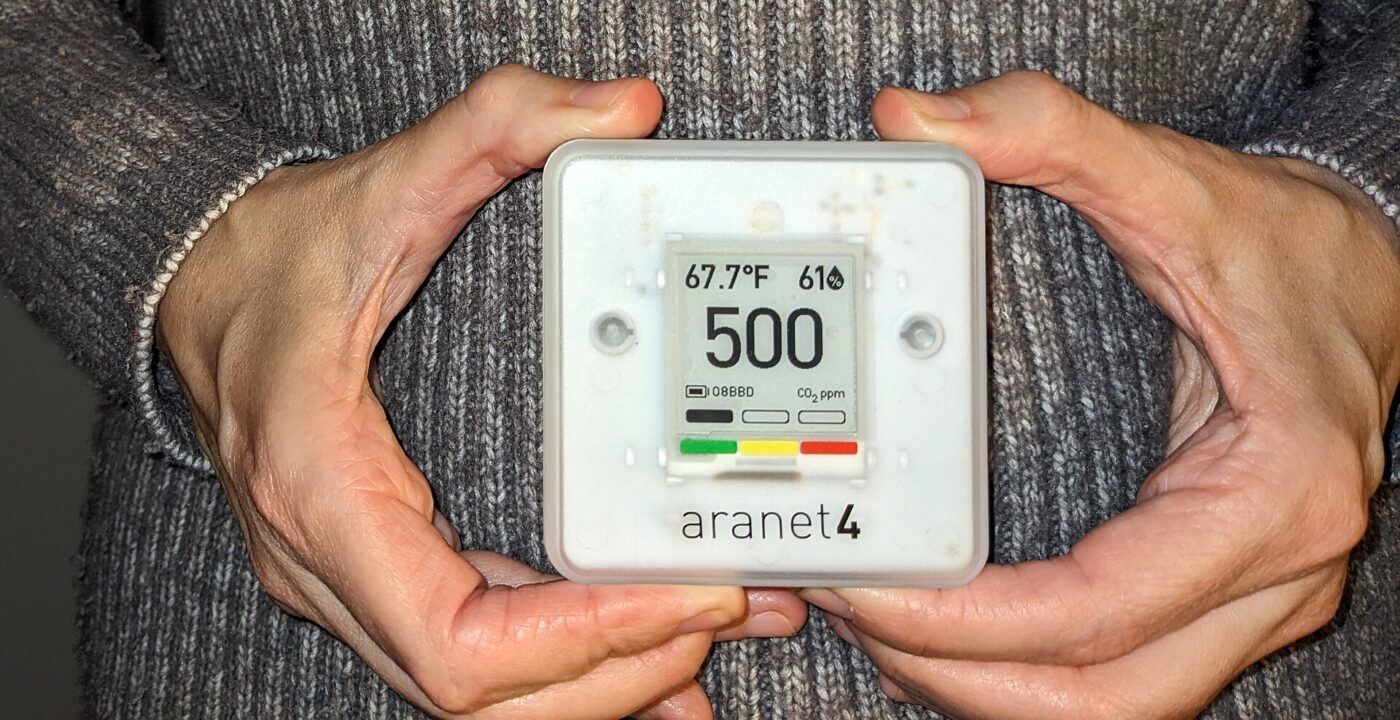
A decade ago, measuring the air inside your own home meant a radon canister from the hardware store and nothing else. In 2026 a $100 desktop box reports fine particles, carbon dioxide, volatile organic compounds, temperature and humidity to a phone, and a federal smoke map shows sensor readings from your neighbors. The hardware arrived fast. The rules for judging it did not.
That gap is the story of this category. The EPA has spent five years publishing performance targets for air sensors, and every one of them is written for outdoor, fixed-location monitoring. For the device on your bookshelf, the agency’s own guidance says the accuracy question is open.
Trend Signal
64/100 Steady momentum
- Emerging
- Rising
- Mainstream
- Peaking
- Cooling
Smoke seasons keep widening while indoor sensor criteria stay unwritten
The National Interagency Fire Center counted 8,554,955 acres burned between January 1 and September 22, 2026, and the EPA states that there are currently no widely accepted indoor performance criteria for most low-cost air pollutant monitors.
Our editorial reading of the cited data, not a forecast. How it is scored
By the numbers
- 8.55MAcres burned in the US between January 1 and September 22, 2026National Interagency Fire Center
- 9.0EPA annual outdoor PM2.5 standard in micrograms per cubic meter, set February 7, 2024EPA
- 4 pCi/LEPA action level for radon in homes; the US indoor average is about 1.3 pCi/LEPA
- 4 reportsEPA voluntary sensor performance target reports, issued February 2021 and February 2024EPA
Why smoke seasons keep pushing sensors indoors
The National Interagency Fire Center report dated September 22, 2026 put the year to date at 56,794 wildfires and 8,554,955 acres burned. For scale, the NIFC annual table shows 5,131,474 acres in 2025, 8,924,884 in 2024, 2,693,910 in 2023 and 7,577,183 in 2022. With three months still on the calendar, 2026 had already burned more acres than every full year since 2021 apart from 2024.
The federal answer to smoke is a public map. The AirNow Fire and Smoke Map, run by the EPA and the US Forest Service-led Interagency Wildland Fire Air Quality Response Program, combines permanent monitors, temporary monitors deployed during smoke events, and air quality sensors covering places with no official station. Its FAQ states that as of June 2026 the map carries crowdsourced PurpleAir data, open data from Clarity sensors, and SensOR and SensWA sensors owned and operated by state air monitoring agencies.
That is the quiet driver behind consumer sales. If a federal map publishes readings from inexpensive sensors where no reference monitor is nearby, buying one for your own street stops looking eccentric. The reach is not small: an EPA news release of July 19, 2021 says the map, launched as a pilot in 2020, drew more than 7.4 million views in its first three months. The same FAQ adds that included sensor data must meet performance targets and technical considerations, and that the EPA is developing a process to let other manufacturers on.
A public map made consumer sensors credible before anyone agreed how to grade them indoors.
The federal targets cover outdoors, not your living room
The EPA’s Air Sensor Toolbox holds the closest thing to a scorecard: performance targets and testing protocols for PM2.5 and ozone sensors published in February 2021, plus supplemental reports in February 2024 for PM10 and for nitrogen dioxide, carbon monoxide and sulfur dioxide. Four documents, all voluntary, and all written for outdoor, fixed-location deployment in what the agency calls non-regulatory supplemental and informational monitoring. The EPA states that air sensors will not meet the stringent requirements for instruments used for regulatory purposes.
Indoors it is blunter. The guidance on low-cost air pollution monitors says there is limited information on their accuracy and precision, and that there are currently no widely accepted indoor performance criteria used for most of them. It lists what moves a reading: placement, time in service, data processing, temperature, humidity, and several contaminants at once. The page on air sensor technology indoors, updated March 18, 2026, adds that gaps remain in what is understood about sensor data quality. The EPA does not endorse specific monitors for indoor use.
- A reading is what that device saw in that spot, not a measurement against a federal method.
- Two monitors in one room can disagree; the EPA lists humidity and placement among the reasons.
What a home monitor can and cannot tell you

The EPA frames the limits in two sentences worth remembering before you shop. First, these monitors only detect the contaminants or factors they were designed for, so one device cannot give a complete picture of indoor air quality. Second, they are not designed to warn of the potential for immediate danger to your health or life, the way a carbon monoxide alarm or a smoke alarm is.
The measurements the agency lists as common in this class are particulate matter, radon, carbon monoxide, carbon dioxide, formaldehyde, volatile organic compounds, temperature and humidity. Most consumer boxes combine three or four. The EPA also cautions that it is not possible to fully understand potential health impacts from a monitor’s detection alone.
We read that as a brief for buyers: treat a home monitor as a change detector, not a verdict. It is useful for showing that carbon dioxide in a closed bedroom climbs overnight and drops when a window opens. It is much weaker as an absolute number, because indoors there usually is no published threshold to compare against.
Buy one to watch a number move, not to certify a room as clean.
The reference numbers worth knowing
There are federal numbers here, but most describe outdoor air. The EPA set the primary annual PM2.5 National Ambient Air Quality Standard at 9.0 micrograms per cubic meter on February 7, 2024, leaving the 24-hour PM2.5 and PM10 standards unchanged, and on March 12, 2025 announced that it would reconsider that revision. A NAAQS is an outdoor standard averaged over a long period against a reference method, and a single indoor reading is not a comparison to it.
Radon is the exception, and the reason a $20 test kit still earns shelf space next to a $200 monitor. The EPA publishes an action level of 4 pCi/L, recommends considering a fix between 2 and 4, and gives the average indoor concentration in American homes as about 1.3 pCi/L against 0.4 outdoors.
| Measurement | Published federal reference | Where it applies |
|---|---|---|
| PM2.5, annual | 9.0 micrograms per cubic meter, February 2024 | Outdoor standard |
| Radon, action level | 4 pCi/L | Indoor air in homes |
| Radon, consider fixing | 2 to 4 pCi/L | Indoor air in homes |
| Radon, US indoor average | About 1.3 pCi/L | Indoor air in homes |
| Carbon dioxide indoors | No federal consumer threshold | No comparison point |
Who should buy one now, and who should wait
Buy now if smoke reaches your area in summer, if you share a small office or bedroom and want to see the carbon dioxide curve, or if you have never tested a basement for radon. Those three uses survive the accuracy caveats: two are about watching a number change, and the third has a federal threshold behind it.
Wait if you want a device whose indoor accuracy has been certified by somebody, because the criteria for that have not been written. Wait too if you were planning to buy a monitor instead of a smoke alarm or a carbon monoxide alarm. And if a listing quotes the EPA sensor performance targets, note that those describe an outdoor field trial rather than the box on your shelf.
What to watch next
- Whether the EPA finishes the process for letting sensors from other manufacturers onto the AirNow Fire and Smoke Map, since data on the map has to meet performance targets first.
- The EPA reconsideration of the 2024 annual PM2.5 standard, announced March 12, 2025, since that is the reference number most monitors borrow.
- The NIFC year-end total for 2026 against the 8,554,955 acres recorded through September 22.
Where to start
Paid links: we earn a commission if you buy through the buttons below, at no extra cost to you. As an Amazon Associate I earn from qualifying purchases.
Home air monitoring types compared on what they actually measure
| Product type | Good fit for | Where to look |
|---|---|---|
| Indoor PM2.5 air quality monitor | Fits smoke season watching | See listings on AmazonOpens Amazon search results, not one listing: check the model on the product page. |
| Carbon dioxide monitor | Fits stuffy rooms and home offices | See listings on AmazonOpens Amazon search results, not one listing: check the model on the product page. |
| Radon test kit | Fits basements and ground floors | See listings on AmazonOpens Amazon search results, not one listing: check the model on the product page. |
Product types that fit the trend described above, not tested models. Check the exact listing before you buy. How we pick them.
Indoor PM2.5 air quality monitor
Where to look: Amazon
The type most people mean by an air quality monitor. Judge it on trends inside your own home rather than the absolute number, and prefer a listing that names the pollutants measured over one selling a branded score.
- Shows particle spikes as they happen
- Useful for cooking and smoke events
- No indoor accuracy criteria exist
- Humidity and placement move readings
Carbon dioxide monitor
Where to look: Amazon
Carbon dioxide is the measurement where a consumer device is most legible, because opening a door produces an obvious change. Check whether the device supports recalibration, since drift is the usual failure after a couple of years.
- Carbon dioxide responds fast to ventilation
- Easy to read as a curve
- No federal consumer threshold to compare with
- Cheap sensors drift over time
Radon test kit
Where to look: Amazon
The one indoor measurement with a federal number behind it. The action level is 4 pCi/L and the EPA suggests considering a fix between 2 and 4, so a test gives you something to act on rather than a trend line.
- EPA publishes an action level of 4 pCi/L
- Cheap for a one-time answer
- Result takes days and a lab
- Single tests vary with weather and season
More: Health and Wellness trends and how the Trend Signal is scored.
Sources
- National Fire News, year-to-date wildfire statistics — National Interagency Fire Center
- Wildfires and Acres, annual totals — NIFC
- Air Sensor Performance Targets and Testing Protocols — EPA
- Low-Cost Air Pollution Monitors and Indoor Air Quality — EPA
- Air Sensor Technology and Indoor Air Quality — EPA
- National Ambient Air Quality Standards for Particulate Matter — EPA
- What is EPA’s Action Level for Radon and What Does It Mean — EPA
- AirNow Fire and Smoke Map Frequently Asked Questions — AirNow
- EPA, Forest Service Release Improved Tools to Equip the Public with Information and Resources, July 19, 2021 — EPA
Questions readers ask
Are home air quality monitors accurate?
The EPA says there is limited information on the accuracy and precision of low-cost air pollutant monitors currently on the market, and that there are no widely accepted indoor performance criteria for most of them. Its performance targets, from February 2021 and February 2024, were written for outdoor fixed-location sensors.
Can a monitor replace a smoke alarm or a carbon monoxide alarm?
No. The EPA states that low-cost air pollution monitors are not designed to warn of the potential for immediate danger to your health or life the way carbon monoxide alarms and smoke detectors are.
What PM2.5 number counts as high?
The EPA set the primary annual PM2.5 outdoor standard at 9.0 micrograms per cubic meter on February 7, 2024, and announced on March 12, 2025 that it would reconsider it. That figure is an outdoor standard averaged over a year using reference methods, not a threshold for one reading on a home device.
Why does a federal map show data from consumer sensors?
The AirNow Fire and Smoke Map combines permanent monitors, temporary smoke-event monitors and sensors covering areas with no official station. Its FAQ says that as of June 2026 the sensor data come from PurpleAir, Clarity, SensOR and SensWA, and that included sensor data must meet performance targets and technical considerations.