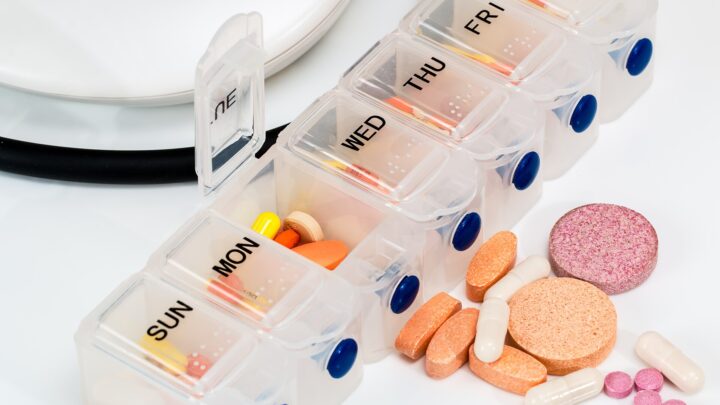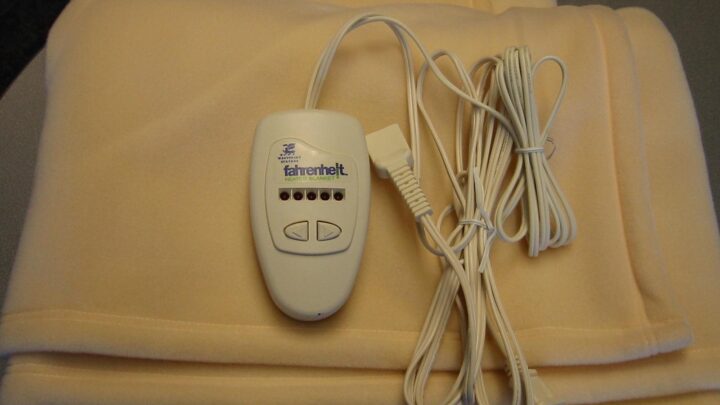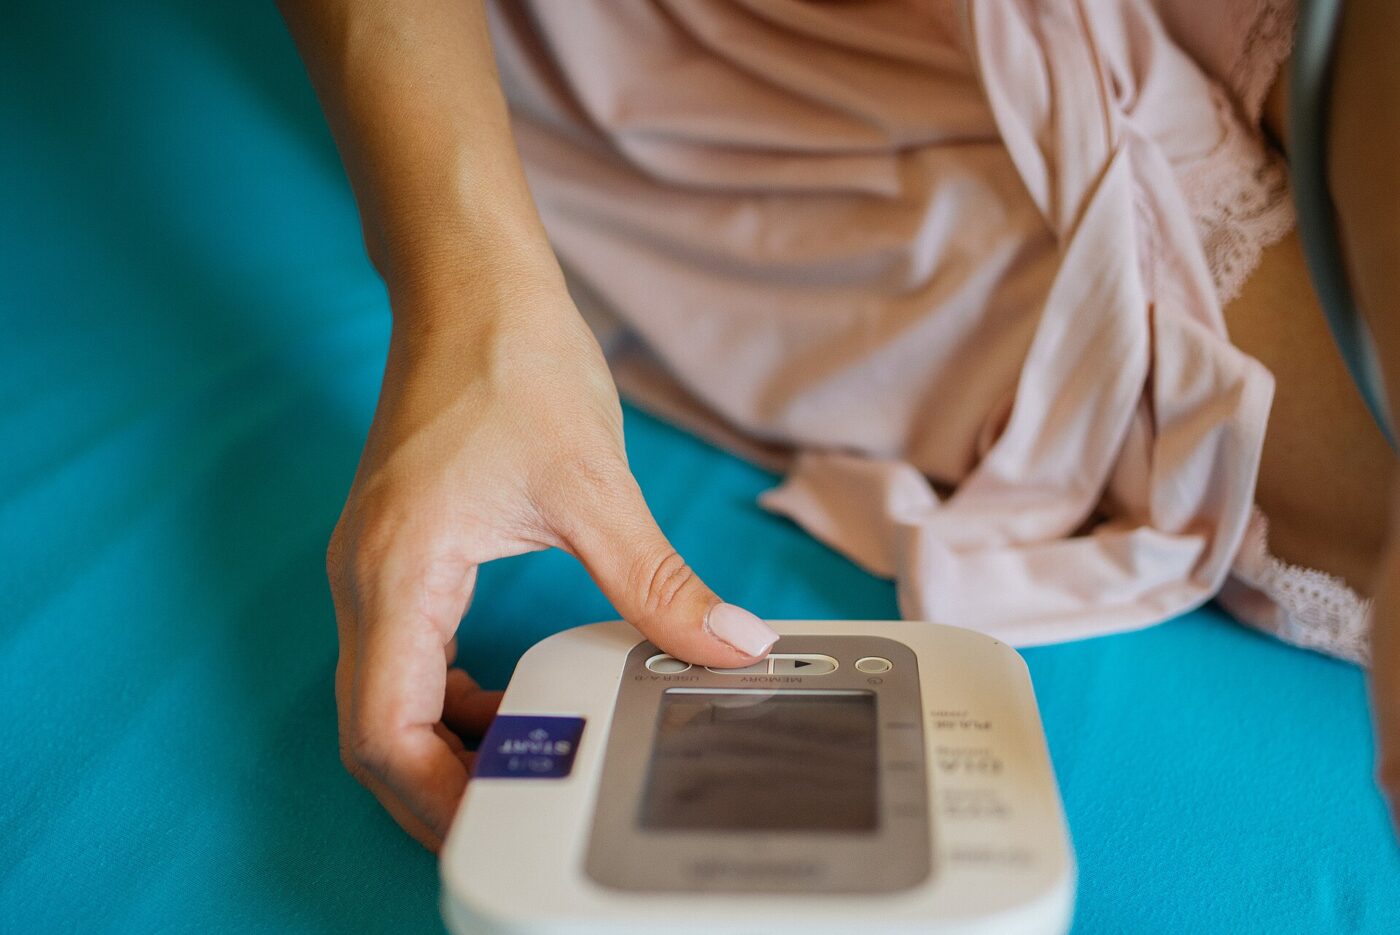
Blood pressure cuffs, thermometers, heating pads, braces and the rest of the drugstore health aisle rarely get a price story, because they rarely move. In 2026 they moved, and in the unusual direction. The Bureau of Labor Statistics consumer price index for medical equipment and supplies stood at 110.294 in August 2026, which is 2.3% below its August 2025 level. Over the same 12 months the all-items index rose 3.4%.
That is a genuine divergence rather than a rounding artifact: the category index peaked in February 2026 and has come down almost every month since. Here is the full price trail back to 2019, what the drop does and does not tell you, and whether it is worth waiting for a better number.
Trend Signal
28/100 Weak momentum
- Emerging
- Rising
- Mainstream
- Peaking
- Cooling
The index peaked in February 2026 and has slipped nearly every month since
The BLS consumer price index for medical equipment and supplies reached 113.857 in February 2026 and fell to 110.294 in August, 2.3% below August 2025, while all consumer prices rose 3.4% over the same 12 months.
Our editorial reading of the cited data, not a forecast. How it is scored
By the numbers
- 2.3%Change in the BLS medical equipment and supplies index, August 2025 to August 2026Bureau of Labor Statistics
- 3.4%Change in all US consumer prices over the same 12 months to August 2026Bureau of Labor Statistics
- 2.7%Change in the broader medical care commodities index over 12 months to August 2026Bureau of Labor Statistics
- 10.3%Total rise in the medical equipment and supplies index since its December 2009 baseBureau of Labor Statistics
The one official index that covers this shelf
BLS tracks this aisle in a single series: medical equipment and supplies in the US city average, for all urban consumers, not seasonally adjusted. Its base period is December 2009 equals 100. The August 2026 reading of 110.294 therefore means, on our arithmetic, that the basket has risen about 10.3% in the nearly seventeen years since that base. The all-items index went from 215.949 to 334.980 over the same span, a rise of about 55% by the same arithmetic.
The caveats matter before the numbers do. This is a basket, not a product: it spans the drugstore health aisle rather than any one cuff or thermometer, so a specific model can move against it. It is not seasonally adjusted, which is why every figure below compares the same month a year apart. And the series has a hole in it: BLS marks October 2025 as unavailable because of the 2025 lapse in appropriations.
We use it because it is the only official monthly price measure covering this shelf. It is not a substitute for watching the price of the exact monitor you want.
One index, one basket, and a gap where October 2025 should be.
The price trail since 2019
Comparing the August reading each year strips out the seasonality and shows where the level was actually set. The shelf got cheaper through 2020 and 2021, jumped hard across 2022 and 2023, went nearly flat for two years, and turned down in 2026.
The trough is the striking part. The index bottomed at 92.219 in December 2020, the lowest reading since the series began, and averaged 96.230 across 2021. From that low to the February 2026 peak of 113.857 is a rise of about 23.5%, again our arithmetic. Almost none of it happened in the last three years; the work was done in 2022 and 2023, when the August-to-August changes were 6.0% and 8.0%.
| August of | Index level | Change from a year earlier |
|---|---|---|
| 2019 | 102.003 | — |
| 2020 | 100.979 | –1.0% |
| 2021 | 96.435 | –4.5% |
| 2022 | 102.264 | +6.0% |
| 2023 | 110.453 | +8.0% |
| 2024 | 111.168 | +0.6% |
| 2025 | 112.865 | +1.5% |
| 2026 | 110.294 | –2.3% |
What turned in 2026
The 2026 path is short and consistent. The index hit 113.857 in February, the highest monthly reading since the December 2009 base, then fell to 113.562 in March, 112.569 in April, 112.573 in May, 110.993 in June and 109.162 in July, before ticking up to 110.294 in August. That is a 3.1% decline from the February peak to August on our arithmetic, inside a year when consumer prices generally were still climbing.
The broader category moved the same way. In its release of September 11, 2026 covering August, BLS reported that medical care commodities fell 0.2% in the month on a seasonally adjusted basis and 2.7% over the 12 months before seasonal adjustment, while all items rose 0.4% in the month and 3.4% over 12 months on the same two bases. So this is not one odd sub-index; the whole medical goods side of the basket was falling while the rest of the shopping list rose.
What the data do not do is explain the cause, and we will not invent one. An index built on collected transaction prices falls when what shoppers actually pay falls, which can come from discounting, from cheaper models entering the mix, or from the sample shifting toward lower-priced sellers. The honest statement for a buyer is narrower and more useful: the direction of travel on this shelf in 2026 was down.
The pressure that has not landed yet
There is a visible source of upward pressure that has not shown up in the index. In its September 2024 action closing the statutory four-year review of the Section 301 tariffs on Chinese goods, the US Trade Representative said it had finalized new timing and rates for tariffs on face masks, medical gloves, needles and syringes. Those are supplies rather than monitors, but they sit in the same import stream, and a category index that keeps falling through 2026 is a reminder that announced tariff schedules and shelf prices are different things with different lags.
A second thing that has not changed is the regulatory floor. The FDA classifies a non-invasive blood pressure measurement system as a class II device under 21 CFR 870.1130, in its cardiovascular panel. A cheaper index does not mean a less regulated product: the device classification is the same whether the monitor costs $28 or $90.
For an anchor on actual shelf prices, the federal record is thin but not empty. CPSC recall notices state what products sold for, and two from this aisle are instructive: heated throws sold on Amazon.com between August 2021 and December 2025 for $40 to $60, and electric heating blankets and pads sold in late 2022 for $25 to $110. Those ranges are consistent with an index that has risen about a tenth in nominal terms since its 2009 base.
Announced tariffs on medical supplies have not turned this index up through August 2026.
Buy now or wait
If you need a monitor, buy it. A category index falling a couple of percent a year does not reward waiting, and seasonal promotions on this aisle swing wider than the index does over a whole year. The useful timing question is the sale, not the month.
If you are replacing something that still works, the index argues for patience of a different kind. Prices are not running away from you, so there is no penalty for waiting until the old device fails. That is the practical meaning of a climb of about 8% from August 2019 to August 2026: this shelf is not an inflation story.
One cost the index cannot see. Where a cuff, a probe cover or a battery is a recurring purchase, the consumable usually outruns the sticker over a few years. Check what the replacement part costs, and whether it is sold separately, before comparing two monitors on price alone.
What to watch next
- The next monthly BLS release, for whether the medical equipment and supplies index keeps falling after the August 2026 uptick to 110.294.
- Whether the Section 301 tariff timing and rates the US Trade Representative finalized for medical gloves, masks, needles and syringes begin to show in the medical care commodities index.
- Whether BLS fills the October 2025 gap in the series left by the lapse in appropriations.
Where to start
Paid links: we earn a commission if you buy through the buttons below, at no extra cost to you. As an Amazon Associate I earn from qualifying purchases.
Home health devices compared on what drives the running cost
| Product type | Good fit for | Where to look |
|---|---|---|
| Upper-arm blood pressure monitor | Fits a regular home routine | See listings on AmazonOpens Amazon search results, not one listing: check the model on the product page. |
| Digital thermometer | Fits a shared medicine cabinet | See listings on AmazonOpens Amazon search results, not one listing: check the model on the product page. |
| Fingertip pulse oximeter | Fits travel and sports bags | See listings on AmazonOpens Amazon search results, not one listing: check the model on the product page. |
Product types that fit the trend described above, not tested models. Check the exact listing before you buy. How we pick them.
Upper-arm blood pressure monitor
Where to look: Amazon
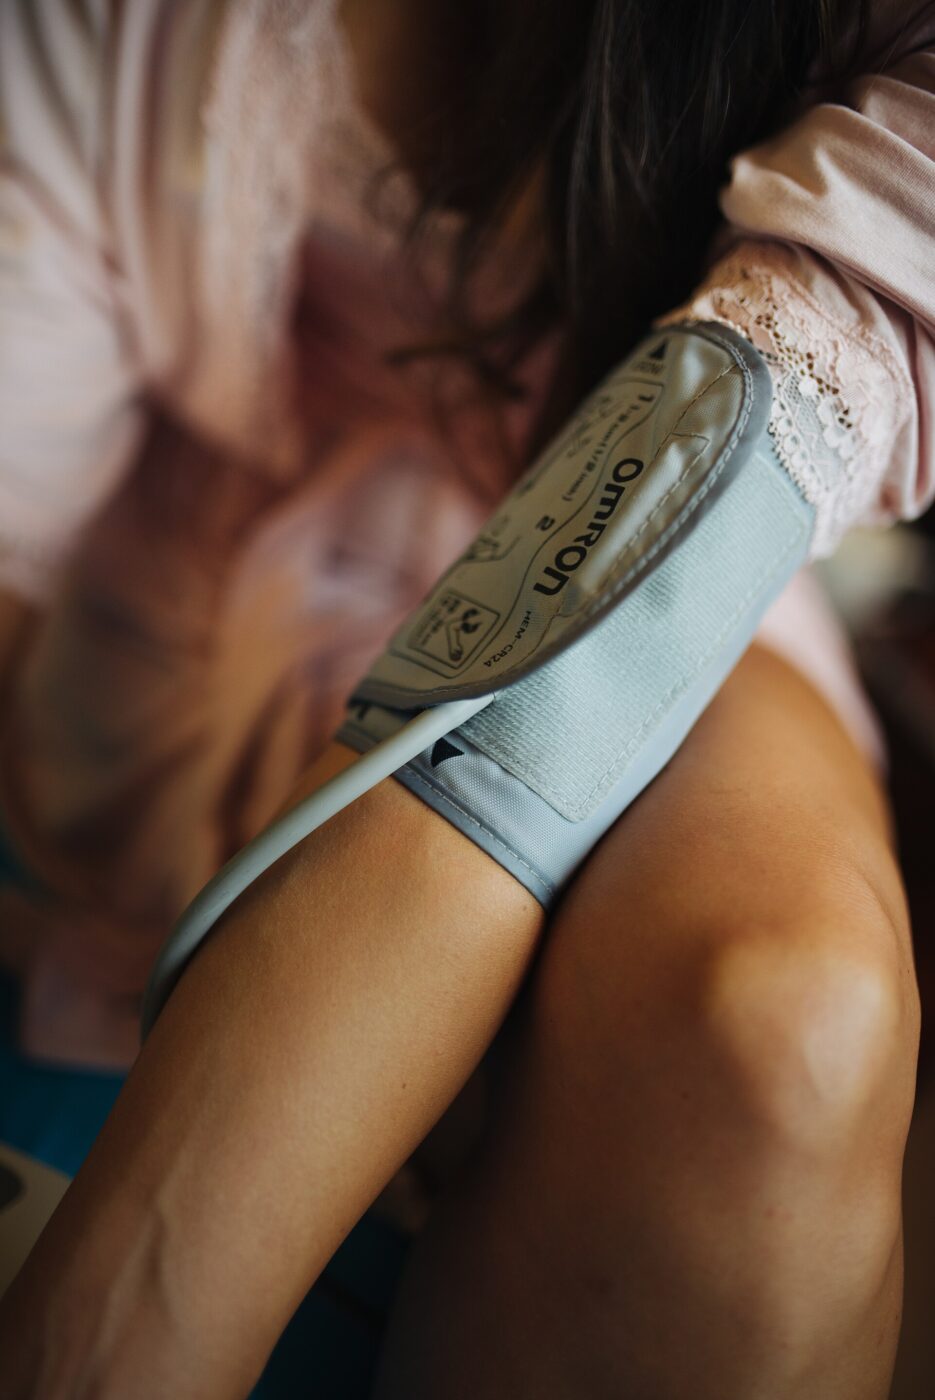
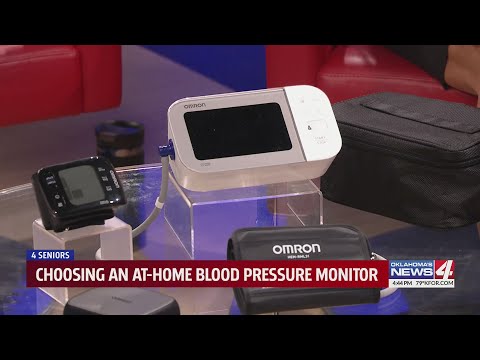
The anchor purchase on this shelf, and the FDA classifies the device type as class II under 21 CFR 870.1130 regardless of price. The cuff is the part that decides whether the box works for you, so measure first and check the printed size range.
- Upper-arm cuffs are the common home format
- Replacement cuffs are widely sold
- Wrong cuff size is the usual complaint
- Some models need an app for history
Digital thermometer
Where to look: Amazon
The least expensive item in the aisle and the one most likely to be bought in a hurry. Listings differ mainly on the measurement site and the read time, and on whether the model needs covers you will have to keep buying.
- Cheap enough to own more than one
- Read times are short
- Probe covers are a recurring cost
- Site matters to the reading
Fingertip pulse oximeter
Where to look: Amazon
The category where listings blur two different products. Read carefully whether a unit is sold for medical use or for sports and aviation, because the packaging often looks the same and the intended use is the difference.
- Small and battery powered
- Sold in a wide price range
- Sports and medical versions look identical
- Cold fingers and polish affect readings
More: Health and Wellness trends and how the Trend Signal is scored.
Sources
- Consumer Price Index, medical equipment and supplies, series CUUR0000SEMG — Bureau of Labor Statistics
- Consumer Price Index news release, August 2026 — Bureau of Labor Statistics
- USTR Finalizes Action on China Tariffs Following Statutory Four-Year Review — Office of the US Trade Representative
- Device classification record for product code DXN, non-invasive blood pressure system — openFDA
- Heated Sherpa Throws and Blankets Recalled, Sold on Amazon by OCTROT — CPSC
- Bedshe International Recalls Bedsure Electric Heating Blankets and Pads — CPSC
Questions readers ask
Are home health device prices going up or down in 2026?
Down, on the official measure. The BLS consumer price index for medical equipment and supplies was 110.294 in August 2026, 2.3% below August 2025, and the broader medical care commodities index fell 2.7% over the same 12 months, while all consumer prices rose 3.4%.
How much have these prices risen over the longer run?
The index base is December 2009 equals 100, and the August 2026 reading was 110.294, so by our arithmetic the basket is about 10.3% higher across nearly seventeen years. Measured from August 2019 to August 2026, the rise is about 8%.
When did the increases actually happen?
Mostly in 2022 and 2023. Comparing August to August, the index rose 6.0% in 2022 and 8.0% in 2023, after falling 1.0% in 2020 and 4.5% in 2021. Changes in 2024 and 2025 were 0.6% and 1.5%. BLS marks October 2025 unavailable because of the lapse in appropriations, so the series has a gap.
Do tariffs affect this shelf?
They are a live source of pressure that had not appeared in the index through August 2026. The US Trade Representative said in September 2024 that it had finalized new timing and rates for tariffs on face masks, medical gloves, needles and syringes as part of the four-year review of the Section 301 tariffs on Chinese goods.